|
Follow the Map
By Michael Cousins
Six Sigma encapsulates the essence of what
process improvement practitioners the world over know instinctively; that
things go wrong because business processes are imperfect. The perfect
process, which to discover is of course a never ending quest, delivers
with 100% reliability exactly what the customer wants, in the timeframe
they want it and at a price they are willing to pay. An imperfect process
will result in occasional late delivery, or delivery of a product that
disappoints the customer. Once a business analyst has correlated customer
dissatisfaction with process imperfection, the stage is set to begin improving
the offending processes to better meet customer need. Six Sigma is just
one of many methodologies, or frameworks, available to the business analyst
to diagnose process flaws, identify ways of removing those flaws and ultimately
phasing in better ways of working.
This article shows how process mapping can be used by the Six Sigma black
belt or green belt to help them in two essential aspects of the Six Sigma
method. The first is in the initial capture of the process where true
understanding of how things are done currently is developed, this being
vital to build an objective case for improving the process. The second
is in the improvement phase itself where it is necessary to prototype,
experiment, communicate and ultimately explain how process improvements
affect the new way of doing things. This article also explains how any
enterprise seeking to document a process can use the distributed process
mapping methodology to get the mapping phase completed quickly and with
the most accurate results, as well as ensuring total staff buy-in and
ownership of the eventual outcome.
Process Mapping Critical Success Factors for Six Sigma
Any organisation seeking to improve processes as part of a Six Sigma initiative
must also have a methodology for mapping the processes. And this methodology
must get 3 critical success factors right:
| 1. |
It must capture the processes in a timeframe that
is reasonable for the project (improvement initiatives can fail simply
because by the time the problem has been properly diagnosed, the customer
has already fled or the organisation has lost interest in implementing
a solution) |
| 2. |
It must capture the processes accurately (an inaccurate
process map is less than worthless, it fosters bad decision making;
if the best outcome from the process mapping phase of a six sigma
project is an inaccurate or out of date process map, then the project
may not just be a complete waste of time and money, it could actually
be very damaging to the organisation) |
| 3. |
The processes must be owned by the people that
do them. By extension, any documentation such as process maps, which
serve to explain or assist in the effective execution of the process,
must also be owned by the people that perform the process. Without
complete involvement of the team in the process mapping phase of the
project, disaster could ensue – witness the recent example of
how failure to involve the workforce early, openly and honestly led
to an enormously damaging dispute at BA. Such things are easy to avoid,
but so so difficult to recover from. |
Process Maps Explained
A process is a transformation, it transforms its inputs to its outputs.
A process map is a picture showing how the transformation is carried out.
It shows the inputs and outputs, (best described using nouns) the activities
in between (best described using verbs) and for each of the activities,
the inputs and outputs used and produced. A process is not just about
‘what people do’, equal consideration should be given to ‘what
people produce’. Historically, much emphasis has been attached to
the study of the way people perform their jobs, i.e. the activities they
carry out, or the verbs in the process map. For process improvement considerations,
the emphasis rests more heavily on the outputs a person produces, the
distinction in emphasis being that of activity versus productivity. In
process terms, where a person does their job, the exact way they do it,
what time of day they do it, or what they wear when they do it are largely
irrelevant. A beach in Brazil is a perfectly good office if the required
output is produced on time and at the right level of quality.
Two organisations competing for the same customers are differentiated
on how well they manage to perform their processes, how well for example
they transform market research into product design and development, or
prospective customer interest into professional sales follow-up, and raw
materials into product build. An organisation with effective processes
will meet or exceed customer expectation, organisations on the other hand
with ineffective processes will fail to meet customer expectation in some
particular and will therefore fail to retain those customers.
Distributed Process Mapping
Recall that process mapping must be accurate, it must be fast and it must
involve a high degree of staff ownership. Where in the business or sporting
world can we look for other situations that have the same three critical
success factors? Well, consider the pit stop required by Formula One cars
during a race. Accuracy is obviously an absolute must, to incorrectly
position a wheel or tighten a nut could lead to the death of the driver.
Speed is of the essence, fractions of a second can be the difference between
winning and losing. And ownership is crucial, each member of the pit stop
team must know exactly what is expected of them, and feel responsibility
and pride for doing the job well.
Imagine now two different Formula One pit stop teams. One is called the
centralised team, the other the distributed team.
For the centralised team, when the car arrives the chief engineer jacks
the car up, that same person then goes to each wheel in turn, removes
the old one and fits the new one. He then refuels the car before eventually
removing the jack. It normally takes about three minutes. The distributed
team on the other hand has a specialist stationed at each position. One
jacks the car, four others take a wheel each and a further person does
the refuelling. No more than ten seconds pass before the car is on its
way again. The distributed team is able to achieve several benefits by
using their approach:
| 1. |
By using specialists, people with real practical
experience and expertise, and people who know the process inside out,
they gain a high degree of accuracy. Contrast with the centralised
team who are using a generalist, somebody who knows a bit about everything,
but not sufficiently detailed or practically experienced in any area
to really understand what to do in the event of a problem. |
| 2. |
By spreading the load and performing the processes
in parallel, the car is able to leave the pit stop very quickly. Contrast
this with the centralised team, who may have saved a few pounds on
training and wages, but who can never compete. |
| 3. |
By giving ownership of the task to the specialists,
the specialists feel a genuine commitment and responsibility for doing
the job right. A pit stop team member in the distributed team would
be utterly mortified if a mistake they made cost the team the race,
and they would equally be elated when the quality and speed of their
work helps the team win the race. |
This analogy relates to process mapping surprisingly
closely. When an organisation has decided to document its process, it
has two choices: distributed or centralised. The centralised model requires
that a small team of business analysts, people who are specialist and
experienced in process mapping and therefore typically people with no
practical experience or expertise in the processes they are expected to
map, is formed to map the process. This team must then interview the players
in the process, in sequence rather than in parallel, until every person
has been spoken to. This can take an inordinate amount of time and become
the bulk of the cost of the project. Once the interview phase is over,
the resultant documentation is all too often inaccurate, because it was
produced by people who do not do the process they are documenting, out
of date, because it took too long to create, and not owned by the people
that do the process. The great irony is of course that the reason the
business analyst interviews the people that perform the process is because
they know the answers, and the business analyst doesn’t! It’s
a ludicrous way of doing things.
A far better approach is to develop the process mapping skills of the
people that know the process inside out, and let them document it. This
frees up the analyst who can then focus on the higher value strategic
work, it enables the map to be produced in parallel, and therefore a lot
faster, and it ensures that ownership of the documentation rests where
it should do, with the people that perform the process. Developing the
skills of the workforce in the area of process mapping, and by extension
process improvement, as opposed to developing the knowledge of the business
analyst in the area of your organisation’s processes, is far more
beneficial and enables long term improvement to become deeply embedded
in the organisation.
To summarise the major point then, distributed process mapping requires
the responsibility for process documentation to be assumed by the teams
that perform the process, rather than have those processes documented
on behalf of the team by a person external to the team. The result is
a more accurate, more rapidly produced and more appropriately owned process
map together with a more highly skilled workforce with a greater understanding
of their processes and how to improve them. Everybody wins.
Worked Example
Nearly all commercial organisations receive Invitations to Tender (ITTs).
The ITT is an external trigger, an event that happens that requires a
process to take in order for the organisation to respond. There are many
such process triggers; a customer arriving at a restaurant, a supplier
sending in an invoice, a phone call from a person requiring information
are obvious examples. The ability of an organisation to respond to these
triggers efficiently and with high quality is the extent to which that
organisation has competitive advantage over other organisations that also
receive the same process triggers. If, for example, a burger restaurant
can produce burgers that taste as good as a competitor’s, but at
10% more cost and another 60 seconds in production time, it won’t
be in business very long. The burger production process in the restaurant,
that begins with the arrival of a customer and ends with the customer
taking away the burger, needs to be improved.
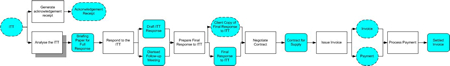
With an ITT, there is a process that receives the ITT, analyses it, responds
to it, follows-up the response, negotiates the contract and ultimately
leads to the issuance of an invoice followed by the receipt of funds.
This level of process description is quite high level, no discussion has
taken place about how to analyse the ITT, what template to use to respond
and where problems occur in the process. Process mapping incorporates
a mechanism that allows the user to draw a process map at a high level
of detail, where the complexity in any particular area is put to one side,
but also allows the reader of the map to navigate to the richer information
sources that reveal the detail under any specific aspect of the process.
In the ITT response process outlined above, note also that no mention
has been given as to what gets produced at each step of the way. It is
essential in process mapping that the map author doesn’t just identify
what they do (their Activities), but also identifies what they are expected
to produce when they perform their Activities (their Deliverables). It
is possible to construct a table, referred to as an IPO table (Input Processing
Output) that is a representation of the ITT response process. This is
shown in Table 1.
| Input |
Processing |
Output |
| ITT |
Generate a receipt and send to customer |
Acknowledgement of Receipt |
| ITT |
Analyse the ITT |
Briefing Paper for Full Response |
| Briefing Paper for Full Response |
Respond to the ITT |
Draft response to ITT
Diarised Follow-up Meeting |
Draft response to ITT
Diarised Follow-up Meeting |
Prepare final response to ITT |
Final response to ITT |
| Final response to ITT |
Negotiate contract |
Contract for Supply |
| Contract for Supply |
Issue Invoice |
Invoice |
Invoice
Receipt of Funds |
Receive Payment |
Settled Invoice |
This equivalent process map representation is given
in Figure 1.
Note how this map describes at each step of the
way what is to be done, and also what the outcome is? Note also how the
map is a logical process, no mention has been made of which department
carries out the various tasks. The elliptical Deliverables are external,
those that either leave or arrive from outside the organisation. A reasonable
question when looking at this map is “How do I analyse the ITT”.
More generally, what is the mechanism for describing in more detail any
specific part of a process map? Conventionally, this is achieved by double-click
drill-down, and is often referred to simply as “drill-down”
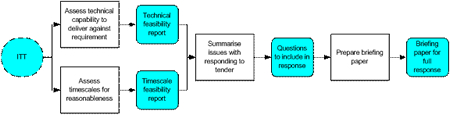
or “activity decomposition”. To extend the example, drilling-down
on “Analyse the ITT” could lead to a map similar to the map
shown in Figure 2.
Note how the inputs and outputs to this map, “ITT”
and “Briefing paper for full response” are the same as the
input and output on the Activity “Analyse the ITT” in Figure
1. This maintaining of the logical flow between different levels in the
process map is an important indicator of good quality documentation.
Applications of the Process Map
Having documented such a process, the applications of it are limited only
by the imagination. It is possible to use the map to help identify where
poor communication lines exist across departmental boundaries, or where
errors occur repeatedly. Value stream analysis can be carried out to help
identify those Activities that the customer actually wants to pay for,
and those they don’t. New staff can be trained using the process
map as a guide, rather than reams and reams of written text.
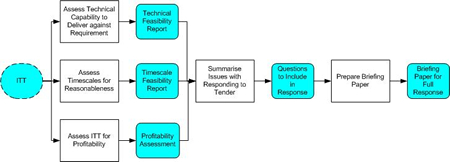
Within a six sigma project, measurements can be captured behind each element
of the map representing the key quantities that are being studied, for
example, I have seen maps used to capture FMEA data to help in subsequent
improvement workshops. In the Respond to ITT process, a key measure could
be the proportion of ITTs won that actually result in a profitable contract.
Suppose this to be 85% at the start of the six sigma project; provided
it can be demonstrated at the end of the project that a higher proportion
of ITTs are profitable then the project has been successful on at least
one count. This could be achieved by realising that in the preparation
of the briefing paper, a preliminary cost assessment needs to be made
to ensure that the organisation can fulfil the requirements of the tender
within a customer supplied guideline, i.e. the drill-down process would
be better with the additional step “Assess ITT for profitability”
shown in Figure 3.
Software Tools to Support Six Sigma
Process Mapping
There is a densely populated market place of vendors of process mapping
products. When last I looked there were some 160 vendors of software tools
claiming to offer at least some degree of process mapping functionality,
so the problem is one of too much choice rather than a scarcity of choice.
However, for the six sigma practitioner, the apparent choice can be narrowed
by clearly understanding the critical success factors behind the project,
and then considering how any particular product helps or hinders the attainment
of this success.
Recall the three critical success factors when documenting processes:
1. Accuracy
2. Speed of capture
3. Staff involvement
The distributed mapping methodology described in this article ensures
each of these objectives are met fully. So, when considering what tool
to use to support your project, the real question is the extent to which
the tool supports the distributed methodology. A software tool that is
targeted at business analysts, requiring highly technical skills or deep
consultancy type knowledge to use or exploit is most unlikely to work
in a six sigma environment. A product that can be used by people with
limited exposure to the ideas of business processes is much more likely
to deliver the required result.
Although it is not possible to supply a definitive list of functional
requirements that a product must meet in order to be short-listed for
use on a six sigma project, there are certainly at least three key questions
that need ‘Yes’ responses before you spend any time looking
more closely at a product. These are listed as high priority items in
Table 2. Really, if the answer to any of these high priority questions
on your Request for Information is ‘No’ or ‘Don’t
Know’, don’t waste your time short-listing the product.
Once you have built your shortlist based on the three critical high priority
questions, the remaining questions and a suggested priority will help
you ultimately select a product. Of course, you must really construct
this list for yourself based on the actual project requirements you have,
the questions are guidelines only. An assumption is made in this list
of requirements that the basics are covered, i.e. drill-down, ease-of-use
etc.
| Requirement |
Priority |
Comment |
| Does the process mapping tool support distributed process mapping? |
High |
This is the start point. If the answer to this question is No, then
really the product is unsuitable for six sigma. Any tool requiring
a centralised approach to process mapping necessarily requires a business
analyst to spend time capturing processes on behalf of everybody else,
chewing up precious time, burning through money, confusing process
ownership and building inaccurate process models that few people can
understand. |
| Does the tool expose an open interface so that you really own the
data and can do with it what you like? |
High |
Proprietary storage formats are also an absolute non-starter. Unless
the product exposes its data so that you can get to it, you will be
forever frustrated in your attempts to gain value from the product.
There are a variety of ways mapping tools expose their data, but really,
these days XML is the way to go. If you are looking at a mapping product
and the tool does not expose all its data in an XML format, the tool
will be much more difficult to integrate with other applications and
it should be excluded from your shortlist. |
| Can the tool help me continually improve the end-to-end processes
within the scope of my project? |
High |
Again, this is an absolute need. It is a waste of time simply mapping
a process if the map itself cannot then be used by the people that
do the process to actually capture the data that will help you drive
continual improvement and diagnostic workshops. When you process map,
you aren’t just seeking to produce a ‘picture’,
you are seeking to produce a digital model that can live and grow
with your business. |
| Ability to create process maps in a Web site format. |
Medium |
The Web is a perfect vehicle for everybody in your organisation
to view the process maps, perfect because it is free and read only.
Unless you can, with just a few clicks of the mouse, actually generate
the entire process map in Web format, complete with click-through
navigation links, links to supporting documentation and re-sizeable
views, you are giving yourself a headache you don’t need. Look
very closely at product capabilities in this area, and accept nothing
less than a 100% reproduction of your process maps in Web format with
no additional time required on your part. |
| Ability to capture whatever process data you need to support your
project. |
Medium |
Unless you can specify the process characteristics you are interested
in capturing, what is the point of using a product at all? So, your
mapping tool must support complete customer ownership of the definition
of the data captured with the process map, and ideally not by having
to edit a SQL Server database either! |
| Easy symbol customisation. |
Low |
It is important for you to be able to choose what symbols you use
in your process descriptions. However, you may also discover that
the vendor supplied symbols are perfectly adequate, and do you really
want to invest the time and money to modify them? Given a choice between
two products, their only difference being the ability to customise
the symbol set, go with the customisable version. |
| Automated alerts and notifications. |
Low |
This area is a strange one. It seems convenient at one level to
be notified automatically every time something of interest happens,
and therefore intuitively of high value. However, in practice, automated
alerts are not as powerful as they first seem as busy people tend
to wait until something is important enough for another person, rather
than a machine, to spend the time to remind them! |
Conclusion
Distributed process mapping can undoubtedly play a major part in any six
sigma initiative. The very act of mapping out a process is itself a great
step forward in understanding how the process can be improved. Combine
this with real-time capture of process related metrics; with the capability
to integrate business process data with other applications; with the increased
knowledge, skills and buy-in of the workforce, then process mapping can
actually help transform an organisation. Process Navigator, from my own
company Triaster, was one of the first tools in the marketplace in December
2000 to offer a fully distributed approach to process mapping, and this
can be downloaded from http://www.triaster.co.uk
if you would like to see how such a tool could help with your project.
If there is one principle that stands out above all others in the domain
of process improvement and process mapping, it is the one captured very
nicely by Elna Blass, director of process innovation at Harley Davidson
.
“Blass’ basic approach is to offer her services, get people
understanding the process, and then get out of the way. She consults closely
with the business unit in question but makes its staff do the work of
process mapping … Harley recently redesigned its invoicing system
to a deafening silence and no resistance.”
Harley Davidson, with their distributed approach to process mapping, are
clearly a winning team; if you are going to use process mapping in your
project, make sure you are like Harley Davidson, and not like the losing
projects that limp home 12 months late and overspent with everybody else
wandering what on earth is going on. With process mapping, distribution
helps ensure complete success, any other way and you are short changing
both your organization and yourself.
(Published in Six Sigma Today Launch Issue, Oct 03)
Dr Michael
Cousins (PhD) is the Managing Director and Chief Software Architect
of Triaster Limited, a software company specialising in the provision
of process mapping software. Triaster has hundreds of clients across
the world, and Michael has worked with many of these organizations
in a consultative and advisory capacity, including Microsoft, Nokia
and the BSi, to help them quickly and accurately capture their enterprise
process maps. He is a regular public seminar speaker, both nationally
and internationally, and has written extensively for the UK quality
and technical press.
Telephone:+44 (0)1491 821800
Email: info@triaster.co.uk
Web: www.triaster.co.uk |

top of page |
 |